MIT Tracks NYC Emissions Block by Block in Real Time
MIT researchers created a system that maps car pollution down to individual streets and hours using existing traffic cameras and phone data. New York City's congestion pricing just proved it works, showing emissions dropped up to 22 percent.
Scientists just turned ordinary traffic cameras into powerful pollution detectives, and the results could help cities everywhere fight climate change more effectively.
MIT researchers developed a way to track vehicle emissions in nearly real time, right down to individual city blocks. By combining data from 331 traffic cameras already installed at Manhattan intersections with anonymized location records from 1.75 million mobile phones, they created the most detailed urban emissions map ever made.
The system uses computer vision to identify vehicle types without recording license plates, protecting privacy while gathering crucial information. It recognizes 12 categories of vehicles with 93 percent accuracy and captures something traditional measurements miss: how traffic signals create stop-and-go patterns that dramatically increase pollution.
"Our model allows extrapolating very detailed emission maps, down to a single road and hour of the day," says Paolo Santi, a principal research scientist in MIT's Senseable City Lab. The level of precision was unthinkable just a few years ago.
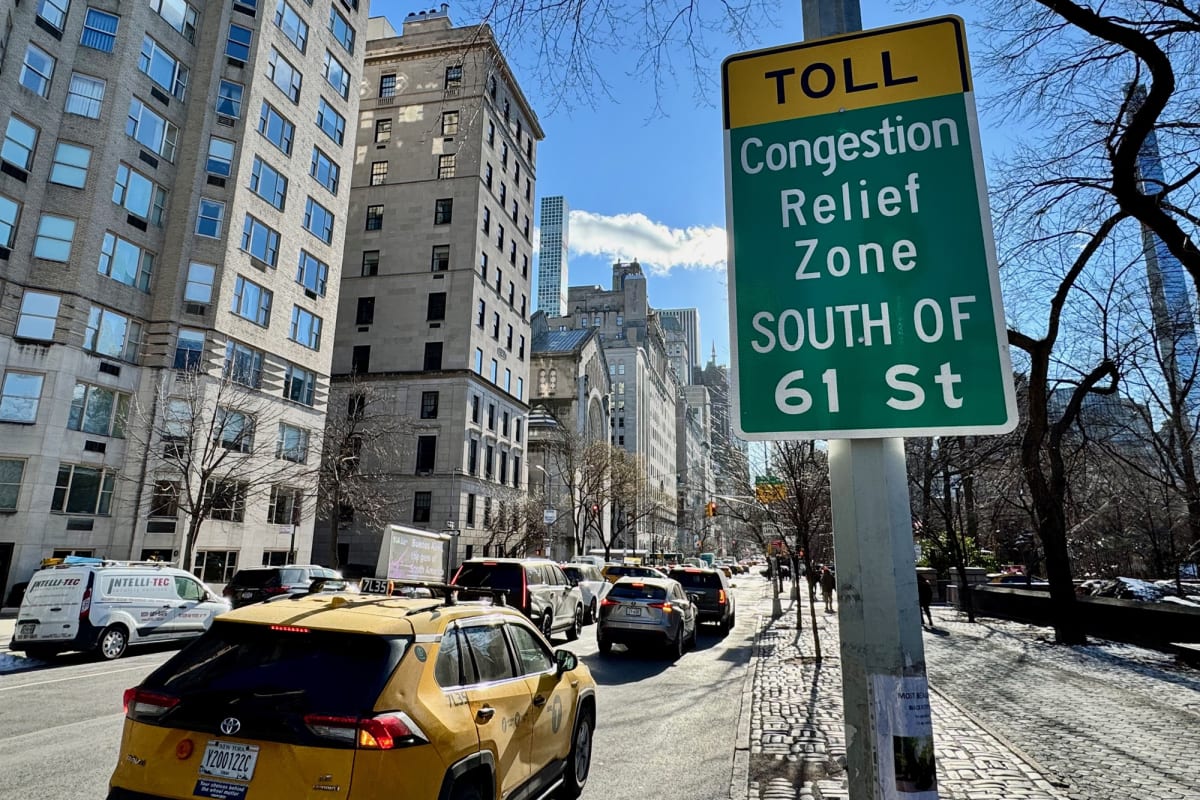
The real world test came in January 2025 when New York City launched congestion pricing in lower Manhattan. The MIT team tracked what happened at two-week intervals after the program started.
Traffic volume dropped about 10 percent. But emissions fell even more, between 16 and 22 percent, matching findings from Cornell University researchers who measured actual air quality improvements.
The Ripple Effect
This breakthrough gives city planners a powerful new tool they desperately needed. Traditional emissions inventories sample vehicle pollution intermittently and miss important details. Highly detailed studies focusing on individual cars don't scale up to cover entire cities.
The MIT approach bridges that gap using technology already in place. Cities don't need expensive new infrastructure or equipment. They can use existing cameras and data sources to understand exactly where and when pollution happens.
The researchers tested other scenarios too. They modeled what would happen if rush hour traffic spread out over longer periods, or if more people switched from cars to buses. When they compared their detailed approach to simpler citywide averages, they found the rougher estimates could be off by up to 49 percent.
That margin of error matters tremendously when cities are making billion-dollar decisions about transportation policy and public health. Knowing which specific streets see the biggest emissions drops helps target interventions where they'll do the most good.
The system also revealed that congestion pricing's benefits weren't evenly distributed. Some major streets saw dramatic improvements while effects varied in areas outside the pricing zone.
Cities worldwide struggling with air quality now have a practical roadmap for measuring and reducing vehicle emissions without guessing.
Based on reporting by MIT News
This story was written by BrightWire based on verified news reports.
Spread the positivity!
Share this good news with someone who needs it