Scientists Map 54,000 Brains to Detect Disease Early
Researchers created growth charts for the brain using MRI scans from over 54,000 people worldwide. The breakthrough tool helps doctors spot signs of Alzheimer's, schizophrenia, and other conditions years earlier than before.
Doctors can now compare your brain to a global reference map of healthy aging, thanks to a breakthrough seven years in the making.
Researchers at USC's Stevens Neuroimaging Institute analyzed brain scans from 54,583 people across 19 countries to create the largest reference model ever made for how our brains develop and age. Think of it like the growth charts pediatricians use to track whether a child's height and weight are on track, except this measures the brain's white matter, the network of neural wiring that keeps different brain regions talking to each other.
The tool uses diffusion MRI, a special type of brain scan that tracks how water moves through brain tissue. Because water flows differently around nerve fibers and their protective coating called myelin, these scans reveal tiny changes invisible on regular brain imaging.
Dr. Julio Villalón-Reina, who led the research, explains it simply: "That gives us a powerful new way to identify when an individual's brain wiring falls outside the expected range." The charts show what's typical at every age and reveal that different brain pathways mature on their own timelines.
The team discovered something fascinating about brain aging. Brain pathways that develop last during childhood and adolescence turn out to be the most vulnerable to decline in older age, confirming a theory scientists have suspected for years called "last in, first out."
The Ripple Effect
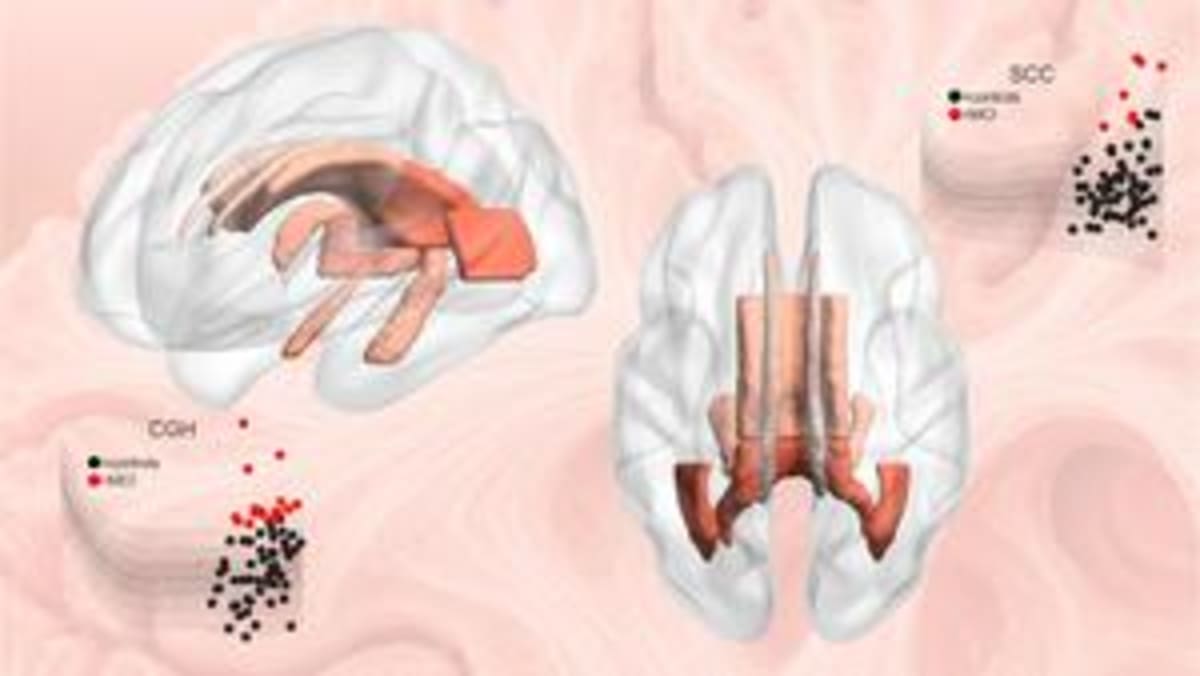
The real magic happens when doctors apply these charts to individual patients. When researchers tested the model on people with mild cognitive impairment, dementia, and a genetic condition linked to schizophrenia risk, it spotted abnormal patterns in each person's brain wiring. Even more importantly, no two people with the same diagnosis showed identical changes, proving that personalized medicine for brain health is finally possible.
Dr. Paul Thompson, senior author of the study, spent seven years building this tool because of its potential to transform treatment. Doctors can now see exactly how your brain differs from what's expected for your age and sex, making clinical trials for brain diseases far more precise.
The charts are already being used to compare more than 30 different brain diseases and conditions. Researchers worldwide can access them freely and add new data as it becomes available, making the tool smarter over time.
For people with memory problems or at risk for conditions like Alzheimer's or schizophrenia, this means earlier detection and better tracking of whether treatments are working. Instead of waiting for symptoms to become severe, doctors can spot subtle warning signs and intervene sooner.
This is what happens when scientists around the globe share data for the greater good: a common framework that helps everyone understand brain health better.
More Images

Based on reporting by Google News - Scientists Discover
This story was written by BrightWire based on verified news reports.
Spread the positivity!
Share this good news with someone who needs it