Scientists Create Real-Time Map of Arctic Permafrost Thaw
Scientists launched an interactive website that tracks melting permafrost across the Arctic in near-real time, helping communities prepare for ground collapse and plan safer construction. The system monitors over 4 million lakes using satellite imagery and AI to detect changes that signal thawing ice.
Imagine the ground beneath your home suddenly sinking because the ice that held it stable for thousands of years melted in a single summer. That's the reality facing Arctic communities as permafrost thaws at an alarming rate.
Scientists just created a powerful tool to help. An international team launched an interactive website that tracks permafrost thaw across the Arctic in near-real time, giving communities advance warning about where the ground might collapse next.
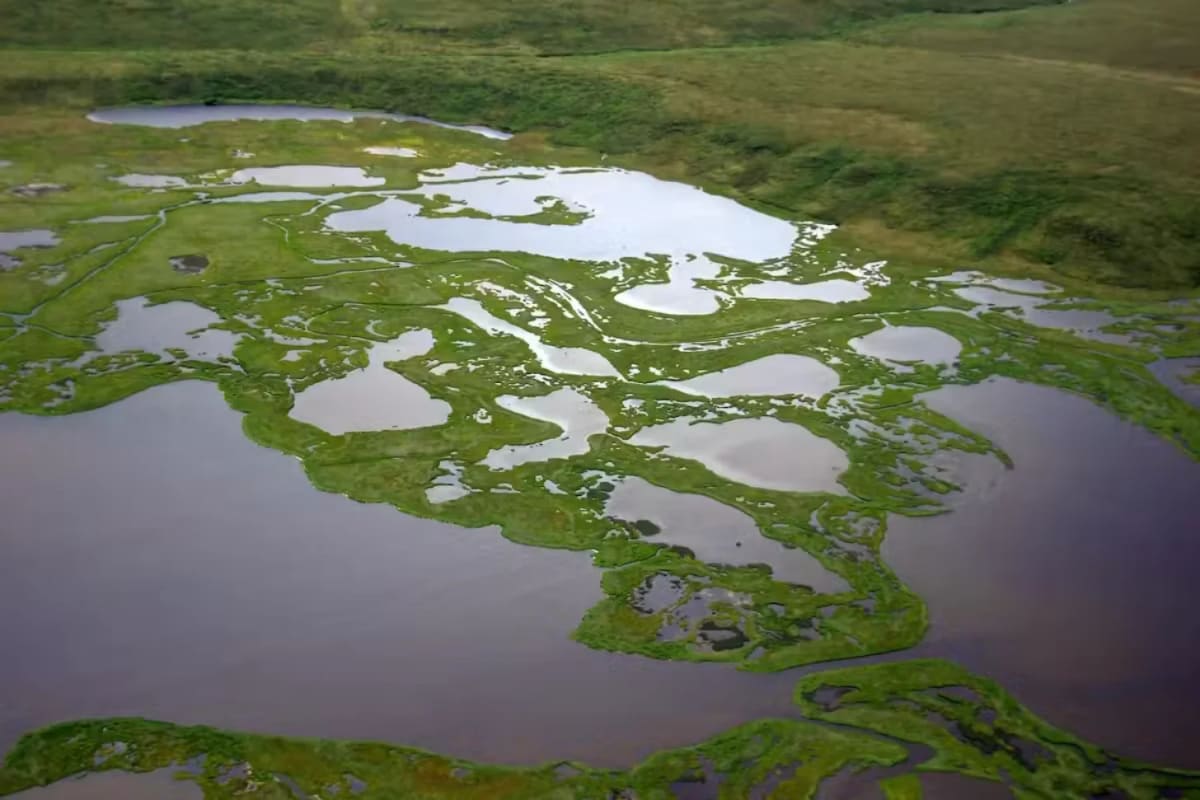
The system works by monitoring something you can see from space: thermokarst ponds. When ice-rich permafrost thaws, the ground collapses into depressions that fill with water, creating distinctive lakes and ponds dotting the landscape. Sometimes these lakes disappear overnight as new drainage channels form, which is a clear sign that permafrost below has thawed.
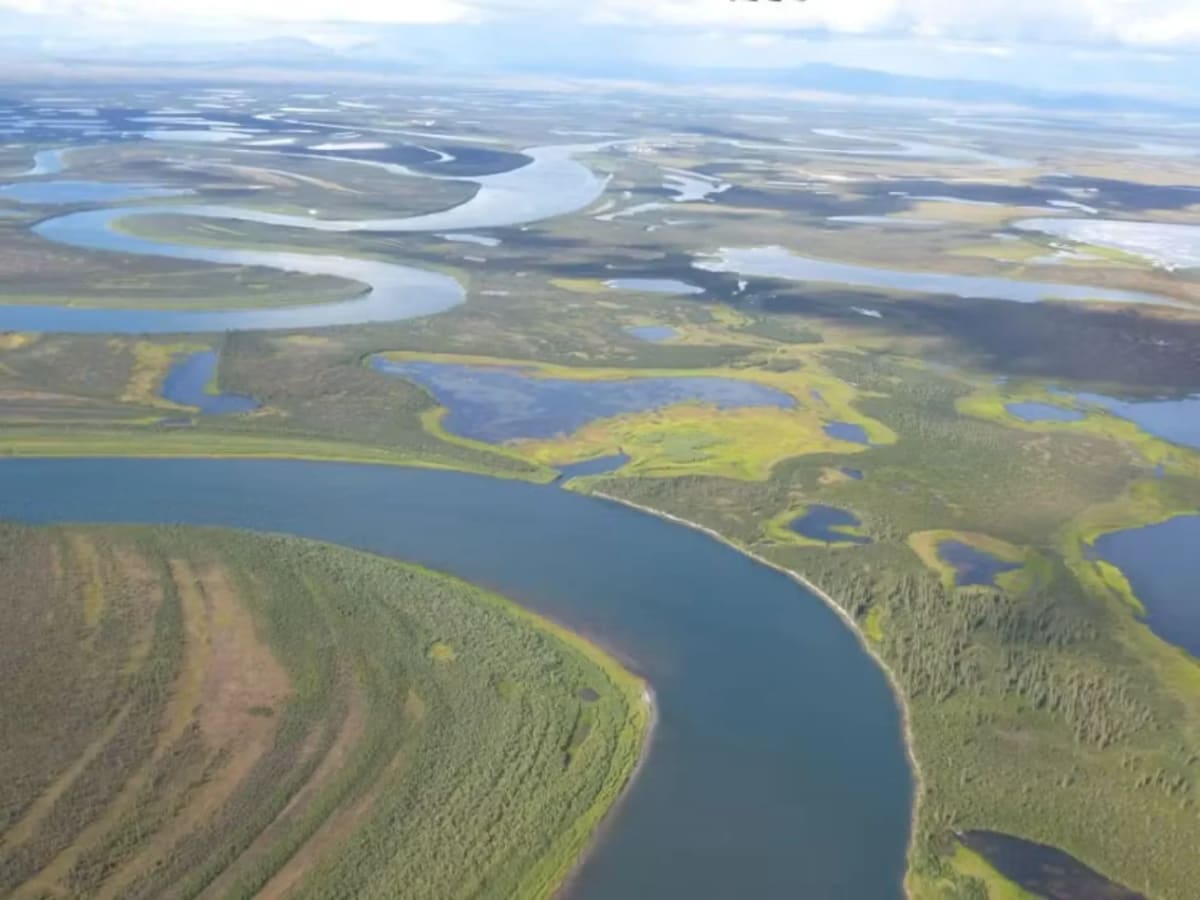
Using artificial intelligence to analyze satellite imagery, researchers now actively monitor over 4 million lakes across the Arctic, including 70 million thermokarst ponds across Alaska's tundra. The system can spot new ponds appearing or old lakes vanishing, both indicators of permafrost changes happening below.
The Seward and Baldwin peninsulas in northwestern Alaska are experiencing dramatic changes. In summer 2018 alone, nearly 200 of the region's 4,600 lakes lost more than a quarter of their area following an unusually warm winter. This summer, about 30 more lakes drained despite a colder winter, suggesting ongoing permafrost thaw.
These changes matter because buildings, roads, and pipes built on thawing permafrost face the same fate as structures swallowed by Florida sinkholes. As Arctic temperatures rise two to three times faster than the global average, the risk keeps growing.
The Ripple Effect
Communities can now access up-to-date information before planning new construction instead of waiting years for scientific studies to publish. The maps show where land contains ice-rich permafrost that makes bad building sites and where frozen soil has less ice, indicating safer ground for development.
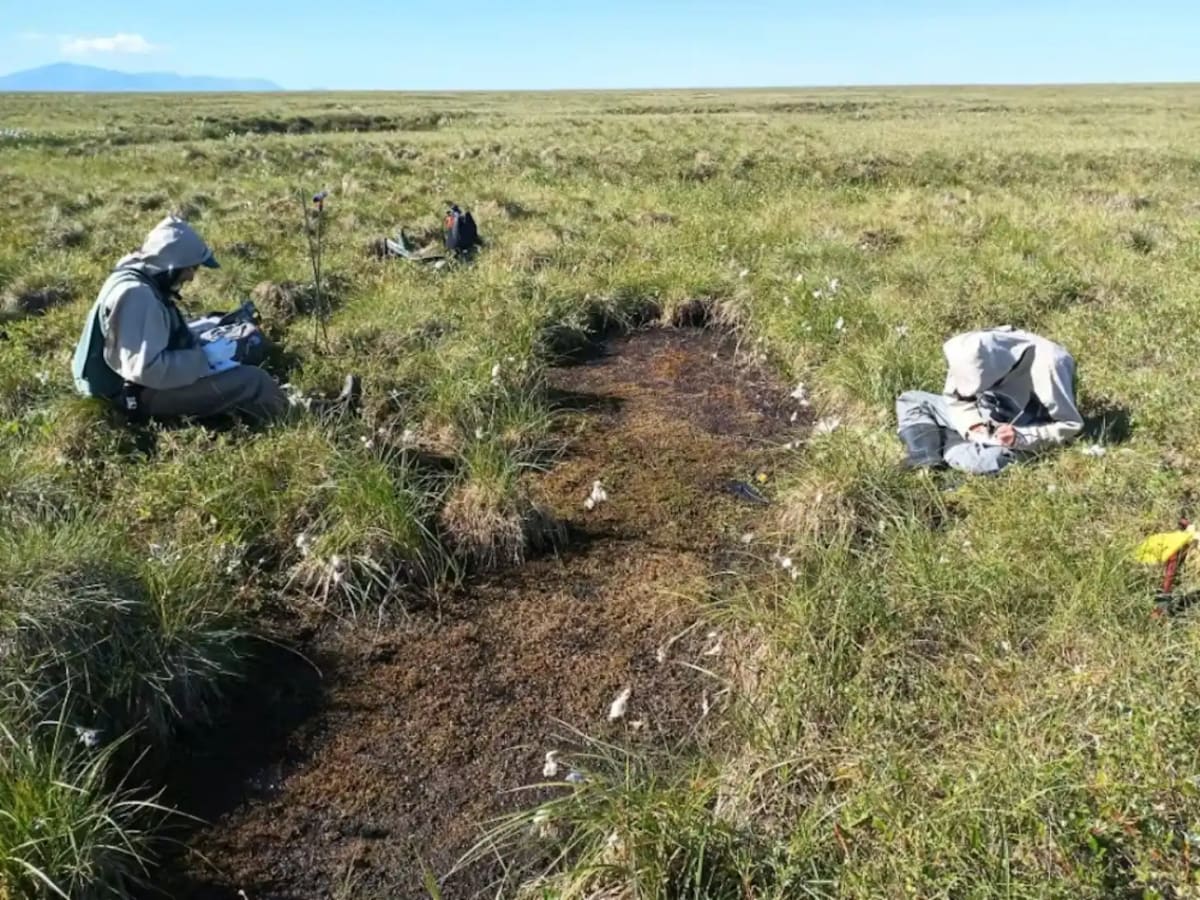
Researchers benefit too, gaining the ability to study permafrost thaw processes more closely as they happen. The near-real-time data reveals patterns that were invisible when scientists only had historical photos from decades past.
The tool represents a shift from reactive to proactive planning. Arctic residents and community leaders can finally see what's happening beneath their feet and make informed decisions about their future, turning a looming threat into a manageable challenge.
More Images

Based on reporting by Good Good Good
This story was written by BrightWire based on verified news reports.
Spread the positivity!
Share this good news with someone who needs it